WeedsViz
Sacramento and San Joaquin River Herbicide Usage and Water Quality
.png)
(Photo credit to Division of Boating and Waterways)
We developed a user interactive map tool to visualize DBW's daily herbicide application logs. The map keeps track of how often a particular site was treated, what herbicide was used and how did treatment change from year to year.
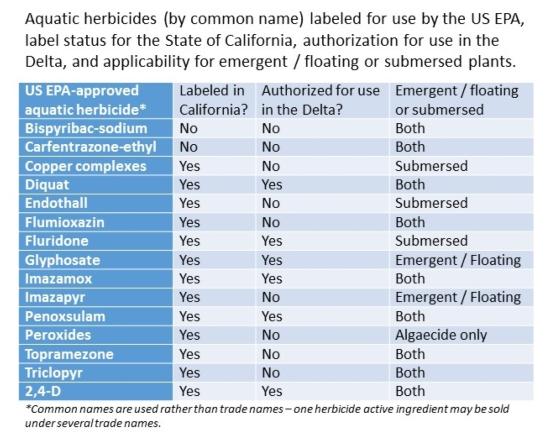
(Photo credit to University of California, Division of Agriculture and Natural Resources, Delta Region Areawide Aquatic Weed Project)
California Office of Environmental Health Hazard Assessment (OEHHA) has established Public Health Goals (PHGs) for the level of chemical contaminants in drinking water. DBW monitors Glyphosate and 2,4-D residue on samples sites.
DBW Herbicide Residue Monitoring Results
| Site | Herbicide | Date Applied | Gallons Applied | Residue after one Week (ppb) |
|---|---|---|---|---|
| Site 278: Cache Slough, Hass Slough | Glyphosate | 6/21/2017 | 2 | 0.63 |
| Site 279: Hass Slough, Duck Slough | Glyphosate | 6/21/2017 | 1.5 | 1.01 |
| Site 6: French Camp Slough | 2,4-D | 7/5/2017 | 1.25 | 0.55 |
| Site 9: Burns Cutoff | 2,4-D | 7/5/2017 | 1.25 | 0.76 |